Monitoring Kubernetes clusters
This feature is experimental and not intended for use in production environments.
If you have enabled integrated monitoring during your Kubernetes cluster deployment, that means that the cluster has the monitoring_enabled=true label and the following components installed:
-
Prometheus for data collection, storage, and search:
-
node-exporterexposes various server-level and OS-level metrics. -
kube-state-metricsgenerates metrics on the state of Kubernetes objects. -
Alertmanager for alarm aggregation, processing, and dispatch.
-
Grafana server for metrics visualization.
For instructions on how to create and configure Alertmanager and Prometheus instances, refer to the kube-prometheus documentation.
The Grafana server is accessible from within a Kubernetes cluster at the magnum-grafana.kube-system.svc.cluster.local DNS name and TCP port 80.
The metrics on the state of Kubernetes objects are exported at the /metrics HTTP endpoint on the listening port: magnum-kube-state-metrics.kube-system.svc.cluster.local:8080/metrics. The metrics can be consumed either by Prometheus itself or by a scraper that is able to scrape a Prometheus client endpoint. For the list of exposed metrics, refer to kube-state-metrics documentation.
Prerequisites
- A Kubernetes cluster with enabled integrated monitoring is created, as described in Creating and deleting Kubernetes clusters.
To access the Kubernetes Grafana dashboards
-
On the Kubernetes clusters screen, click a Kubernetes cluster.
-
On the cluster right pane, click Download kubeconfig. The .kubeconfig file will be downloaded to your client machine.
-
On your client machine, install and set up the
kubectltool, to be able to run commands against Kubernetes clusters, as described in the official documentation. -
Specify the path to your Kubernetes configuration file in the
KUBECONFIGenvironment variable:
# export KUBECONFIG=`<path_to_kubeconfig>`
- Check that the
kube-prometheusstack is installed:
# kubectl --namespace kube-system get pods -l "release=magnum"
NAME                                                  READY  STATUS   RESTARTS  AGE
magnum-kube-prometheus-sta-operator-85f757c5dc-ckllb  1/1    Running  0         3d17h
magnum-kube-state-metrics-5cc46cbc5f-tclcv            1/1    Running  0         3d17h
magnum-prometheus-node-exporter-99kfc                 1/1    Running  0         3d3h
magnum-prometheus-node-exporter-gwgzr                 1/1    Running  0         3d17h
magnum-prometheus-node-exporter-q2pm2                 1/1    Running  0         3d17h
magnum-prometheus-node-exporter-sqsl7                 1/1    Running  0         2d22h
- Obtain the password of the
adminuser:
# kubectl get secret --namespace kube-system magnum-grafana \
-o jsonpath="{.data.admin-password}" | base64 --decode ; echo
- Configure the port forwarding for the Grafana pod:
# kubectl --namespace kube-system port-forward service/magnum-grafana 3000:80
-
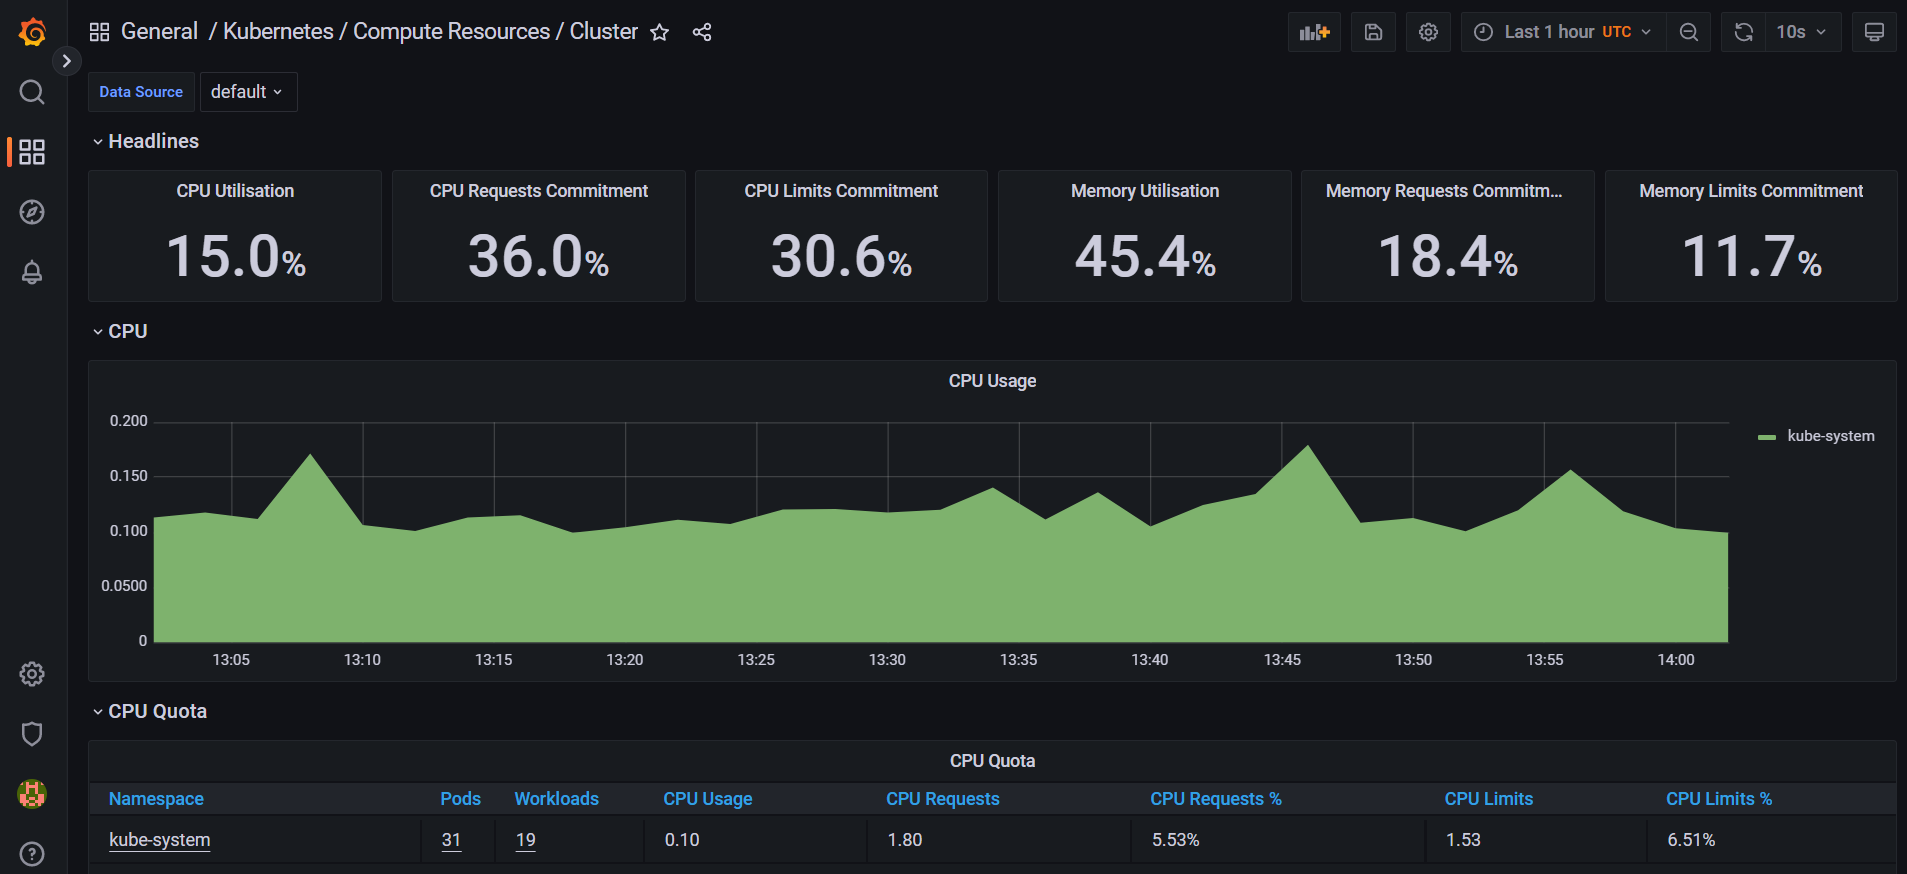
Log in to http://localhost:3000 under the
adminuser by specifying its username and password obtained in step 6. -
In the left menu, click Dashboards > Browse, and then select the dashboard you want to view.
To access the Prometheus user interface
-
On the Kubernetes clusters screen, click a Kubernetes cluster.
-
On the cluster right pane, click Download kubeconfig. The .kubeconfig file will be downloaded to your client machine.
-
On your client machine, install and set up the
kubectltool, to be able to run commands against Kubernetes clusters, as described in the official documentation. -
Specify the path to your Kubernetes configuration file in the
KUBECONFIGenvironment variable:
# export KUBECONFIG=`<path_to_kubeconfig>`
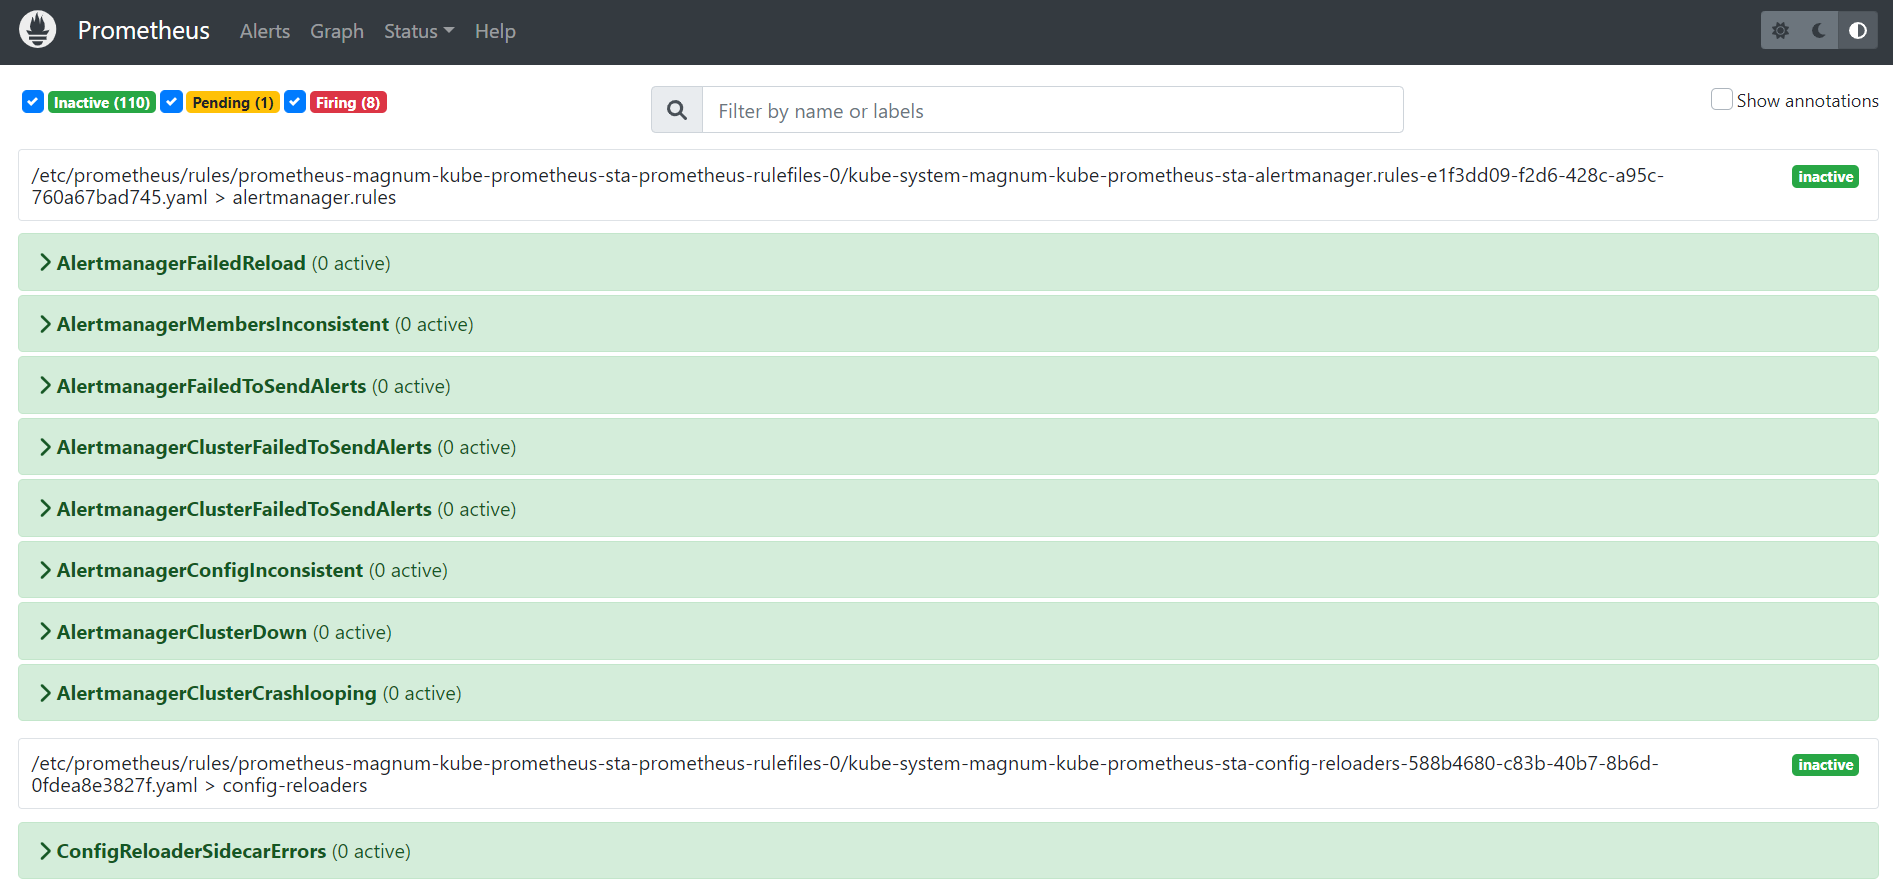
- Configure the port forwarding for the Prometheus pod:
# kubectl --namespace kube-system port-forward service/magnum-kube-prometheus-sta-prometheus 9090
- Visit http://localhost:9090/graph to use the Prometheus expression browser and to graph expressions. You can also navigate to http://localhost:9090/metrics to view the list of exported metrics, or http://localhost:9090/alerts to view the alerting rules.
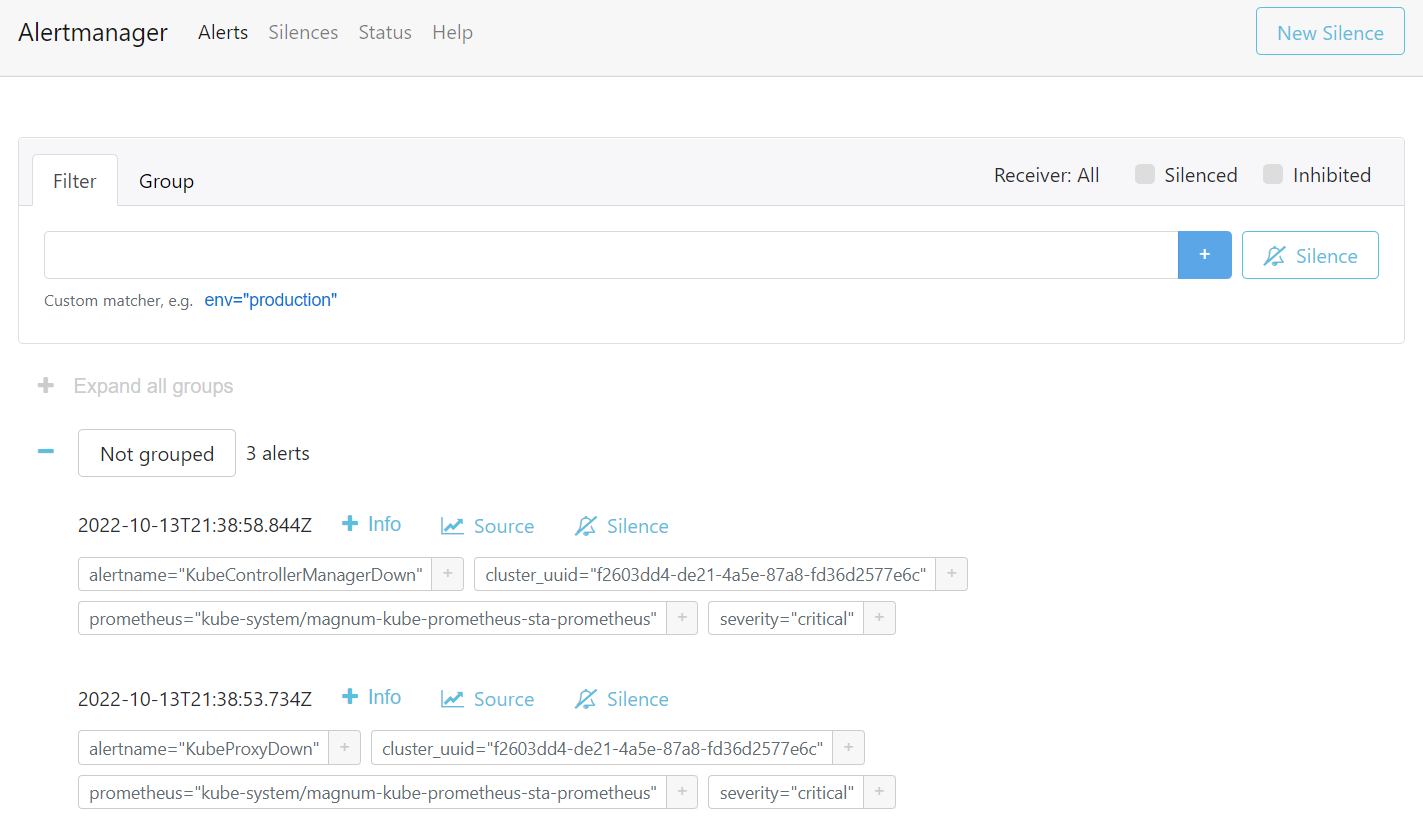
To access the Alertmanager user interface
-
On the Kubernetes clusters screen, click a Kubernetes cluster.
-
On the cluster right pane, click Download kubeconfig. The .kubeconfig file will be downloaded to your client machine.
-
On your client machine, install and set up the
kubectltool, to be able to run commands against Kubernetes clusters, as described in the official documentation. -
Specify the path to your Kubernetes configuration file in the
KUBECONFIGenvironment variable:
# export KUBECONFIG=`<path_to_kubeconfig>`
- Configure the port forwarding for the Alertmanager pod:
# kubectl --namespace kube-system port-forward service/magnum-kube-prometheus-sta-alertmanager 9093
- Visit http://localhost:9093 to access the Alertmanager user interface.